


Python で標準正規分布の乱数を生成するコードのメモです。
標準正規分布とは、平均0、標準偏差1の分布です。
次の2種類の方法をまとめます。
- numpy の randn 関数を利用
- ボックスミュラー法でスクラッチ実装
目次
numpy の機能を利用する
サンプルコード
numpy が利用可能であれば、randn 関数で簡単に生成できます。
import numpy

ns = numpy.random.randn(10)
for n in ns:
    print(n)
$ python3 main.py
-0.4066647873785641
0.46278578574477924
0.5699248477993901
-0.7314960931317872
1.3325366366636897
1.3004643629289956
1.6555700977568601
-0.08526408599124437
0.3908318162712222
0.9855716236250724ヒストグラムを描画
1000万の乱数を生成して、matplotlib でヒストグラムを描画してみます。
import numpy
import matplotlib.pyplot as plt

ns = numpy.random.randn(10_000_000)

plt.hist(ns, bins=1_000)
plt.show()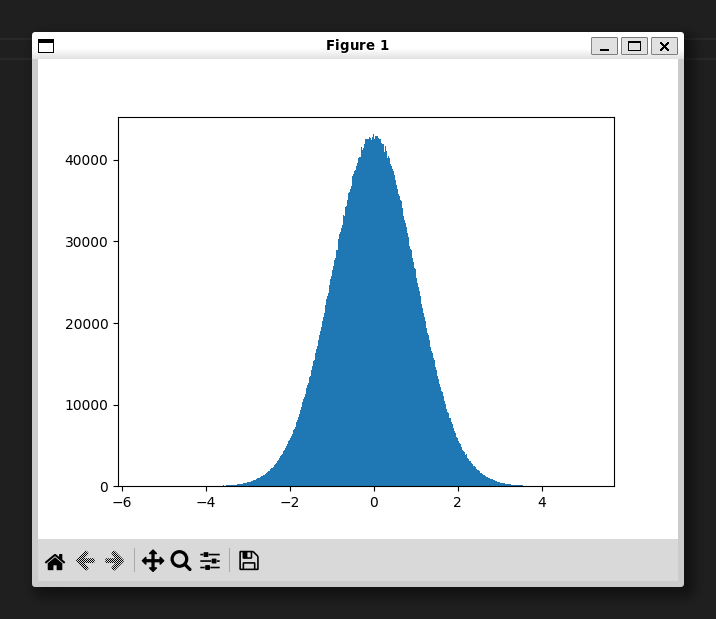
ボックス=ミュラー法を実装する
標準正規分布の乱数を生成するための有名な方法として、ボックス=ミュラー法というのがあります。
標準正規分布の乱数を実直に生成しようとすると、累積密関数の逆関数を計算することになり、大きな計算コストを要してしまいます。
ボックス=ミュラー法では小さな計算コストで、0.0~1.0 の範囲の乱数2つをインプットにして、標準正規分布の乱数2つを生成することができます。
サンプルコード
サンプルコードです。
import math
import random


def box_muller():
    while True:
        x = random.random()
        y = random.random()
        r = math.sqrt(-2 * math.log(x))
        theta = 2 * math.pi * y
        yield r * math.cos(theta)
        yield r * math.sin(theta)


rng = box_muller()
ns = [next(rng) for _ in range(10)]
for n in ns:
    print(n)
$ python3 main.py
-0.8712135486411922
0.42730756128187425
-1.8133317351536529
0.018942848575099126
-0.2858183851652169
0.01098251215892648
-0.17043180581232045
-0.12333910437687097
1.3611857241439924
-0.4100859647205703
動作確認 – 平均と分散の確認
生成した乱数の動作確認として、平均と分散(標準偏差の2乗)をチェックしておきます。
import math
import random

def box_muller():
    # 省略


rng = box_muller()
ns = [next(rng) for _ in range(10_000_000)]

ave = sum(ns) / len(ns)
print(f"average : {ave}")

var = sum([(n - ave) ** 2 for n in ns]) / len(ns)
print(f"variance: {var}")
$ python3 main.py
average : -0.0001232410689302736
variance: 1.000145527280448おおよそ、平均0、分散1となっており問題なさそうです。
ヒストグラムを描画
ヒストグラムも描画しておきます。
import math
import random
import matplotlib.pyplot as plt

def box_muller():
    # 省略


rng = box_muller()
ns = [next(rng) for _ in range(10_000_000)]

plt.hist(ns, bins=1_000)
plt.show()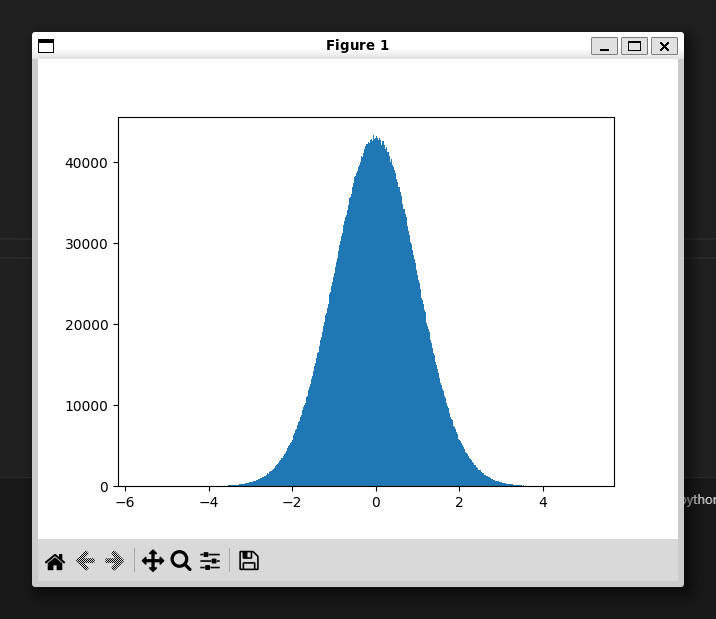

コメント